

Petrophysics
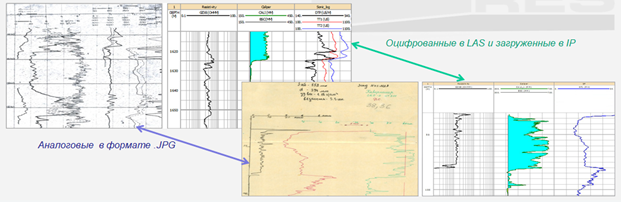
Digitizing
- Digitizing and visualization of paper well log curves from old well
- Digitizing of mud and gas logging data, core descriptions, core analysis results, signs of hydrocarbon in core and cuttings, presence of carbonate differences (calcite, dolomite), luminescence-bitumen analysis data, evidence of presence of fractures and any other text information for visualization on final well charts.
- transfer of information from graphical formats into LAS, TXT, XLS formats for further load into interpretation software
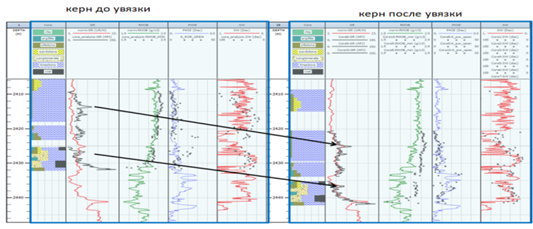
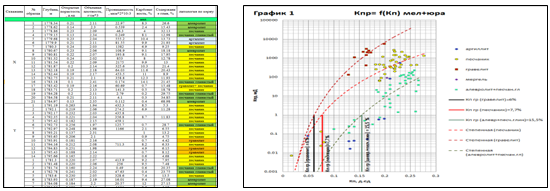
Use core analysis data for calibration of the CPI results and for Reserves Reports
- Core- well logs depth matching
- Definition of cut-off values for porosity, clay content, saturation for each stratigraphic unit with account for lithology of reservoirs
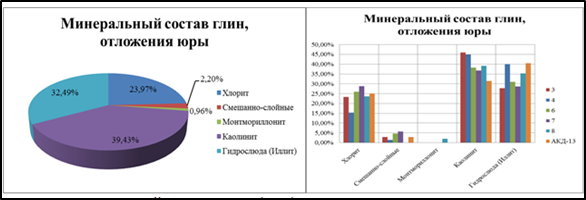
Analysis of clay mineral composition, fractional composition, etc
Gas logging
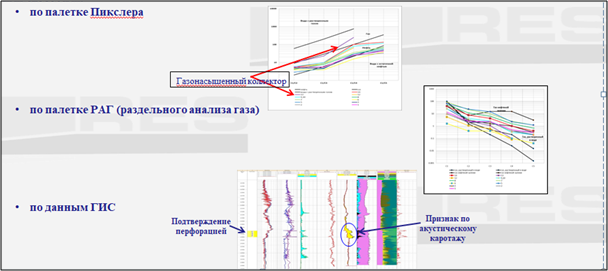
Gas log curves are analyzed for evaluation of reservoir fluid composition in course of drilling or during well logs interpretation to identify gas-saturated reservoirs. In RES several approaches for identification of gas-saturated or high-gas-factor reservoirs are being used:
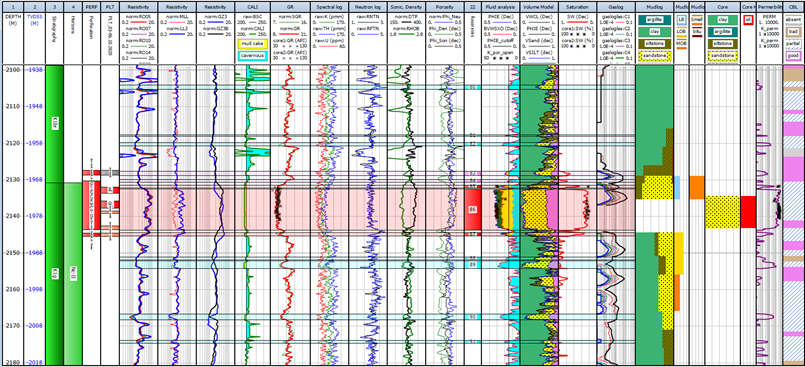
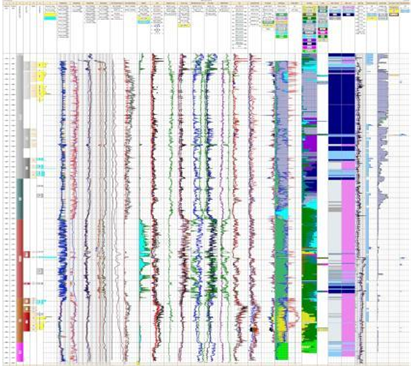
CPI
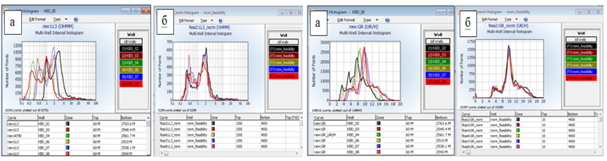
- Well logs normalization
- Lithology interpretation
- Identification of reservoir intervals
- 4. Reservoir properties – porosity, clay content, saturation
- Reservoir fluid type and hydrocarbon saturation
- Recommendations for well testing (openhole and cased)
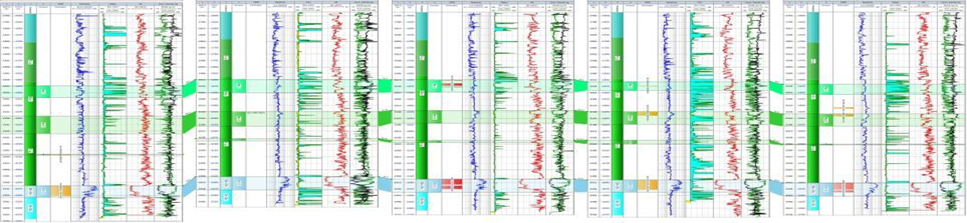
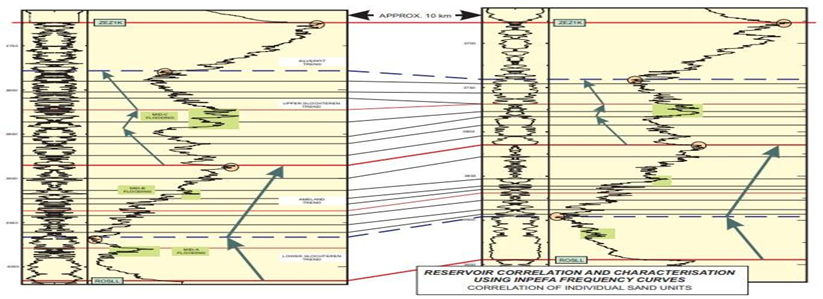
Well correlation
- Identification of reference horizons, their TD and thicknesses in different wells
- Tracing the change in thickness of stratigraphic subdivisions from well to well in the studied area
- Visual representation of changes in the thickness of productive horizons
- Visual representation of regional stratigraphic variability
- Tracing the changes in fluid contact in various blocks – WOC, GWC, GOC.
Well correlation is performed in the IP software package; additionally, cyclic and sequential sedimentation is analyzed using the Cyclolog software package.
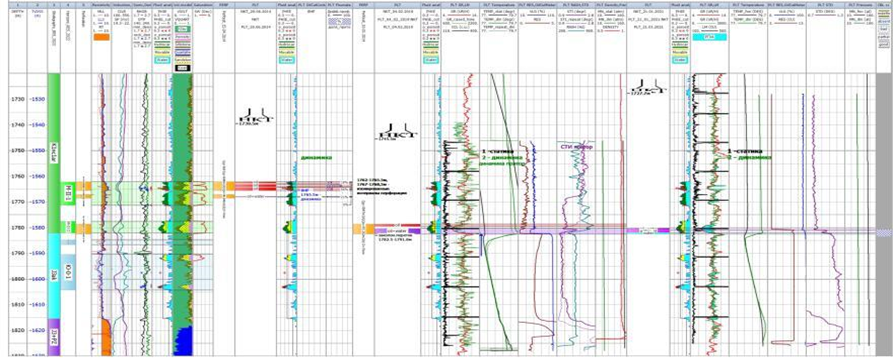
PLT
Allows to analyze the movement of contacts as the productions progresses for identifying working reservoir intervals , well casing damages and the flows behind the casing.
Reserves calculation
- Systematization, analysis and generalization of well logs data
- Systematization, analysis and generalization of core data
- Systematization, analysis and generalization of well tests and production processes
- Identification of oil-saturated intervals
- Determination of porosity, clay content and saturation parameters
- Use of unified approach to the CPI for all wells in the field
- Block structure confirmation
- Calculation of porosity and saturation averaged values
- Building WOC, GWC, GOC charts
- Reserves calculation
- Drafting the reserves report
- Presentation and approval of reserves reports to the State Committee on Reserves
Unified approach to CPI for all wells in the field
Software
- NeuroLog (USA) – for well log digitizing
- LogTools (Russia) – for CPI of Russian and Foreign log data
- Interactive Petrophysics – Lloyd’s Register Digital Products Limited – for CPI of Russian and Foreign log data